Monitoring coastal change using the DEA Coastlines coastal transect tool 
Sign up to the DEA Sandbox to run this notebook interactively from a browser
Compatibility: Notebook currently compatible with both the
NCIandDEA SandboxenvironmentsProducts used: DEA Coastlines
Background
Australia has a highly dynamic coastline of over 30,000 km, with over 85% of its population living within 50 km of the coast. Historical data on how our shorelines have changed over recent decades is critical for understanding and managing the impacts of coastal dynamics on our coastal communities and environments. However, historical coastal monitoring data is often only available for recent years or specific well-studied locations, making it challenging to obtain data on longer-term coastal change.
DEA Coastlines use case
The Digital Earth Australia Coastlines product uses Landsat satellite data to map changing shorelines for each year from 1988 to the present. Each annual shoreline represents a measure of the most-representative shoreline position for each year (specifically, the “median” shoreline position corrected to a consistent 0 metres Above Mean Sea Level tide datum). By tracking the position of these shorelines over time using coastal transects, we can obtain a detailed understanding of coastal change along a beach or region. For example, time-series data extracted from DEA Coastlines at specific transects can be used to:
Track patterns of coastal erosion and growth over time
Compare one year of coastal change to previous decades using routine monitoring transects
Map or predict hotspots of coastal change or vulnerable shorelines
Description
This notebook will demonstrate how to use the DEA Coastlines interactive coastal transect tool to extract time-series coastal change data for any location across Australia. The coastal transect app allows you to analyse DEA Coastlines data directly in the DEA Sandbox without having to download data to your desktop or use a GIS.
The interactive app can be used to draw transects on the map, and use these to track how a coastline has changed over recent decades. Existing transects (i.e. in Esri Shapefile or GeoJSON format) can also be uploaded directly into the tool, and outputs can be exported as both figures and raw CSVs containing shoreline positions for each year since 1988.
The tool requires no coding experience.
Note: For more technical information about the DEA Coastlines product, visit the official Geoscience Australia DEA Coastlines product description. To explore DEA Coastlines on an interactive map, visit DEA Maps.
Getting started
To run this analysis, run all the cells in the notebook, starting with the “Load packages” cell.
Load packages
[1]:
import sys

sys.path.insert(1, "../Tools/")
from dea_tools.app import deacoastlines
DEA Coastlines coastal transect tool
This tool allows you to interactively draw a transect over DEA Coastlines annual shoreline data, and get back a graph showing how shoreline positions have changed over time. To use the tool:
Run the
deacoastlines.transect_app()cell below; an interactive application will appearZoom in on the map and use the
Draw a polylinetool on the left to draw a transect so that it crosses through a set of shorelines (see example below). Transects should be drawn in a consistent direction, e.g. starting on land and finishing over water. This ensures that results can be compared between transects.
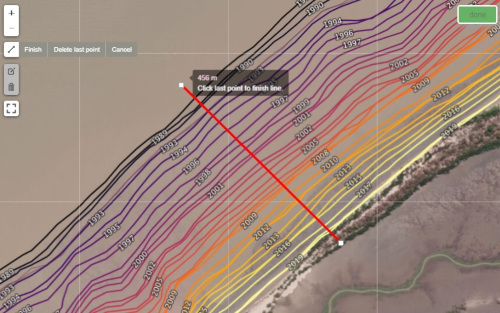
Press
Finishwhen you are happy with the line, then clickDonein the top rightA graph will appear below the map showing distances along the transect to each annual shoreline (distances will be measured from the start of the transect line you drew above)
All outputs from the tools will be saved to a new folder in this directory called
deacoastlines_outputs.
Optional: Set transaction extraction mode to
'width'and re-run the cell below to measure the width between two adjacent sets of coastlines (e.g. across the neck of a tombolo or sandbar).Optional: Upload a GeoJSON or ESRI Shapefile containing transects using the
Uploadbutton to automatically extract shoreline positions from multiple coastal transects (uploaded files should be less than 5 megabytes in size).
[ ]:
deacoastlines.transect_app()
The resulting figure shows how shorelines at this location have changed over time. The tool supports two analysis modes:
In
distancemode, the y-axis shows the distance from the start of the transect to the location at which the transect intersects with each annual shoreline (shown on the x-axis). If transects were drawn with a starting point on land, decreasing distances over time indicate the coastline at this location was retreating or eroding since 1988. Conversely, increasing distances over time indicate the coastline was growing.In
widthmode, the y-axis shows the distance (i.e. width) between the first and last time the transect intersects each annual shoreline. Increasing widths indicate that a sandbar, spit or peninsular was growing wider over time; decreasing widths indicate that it was eroding or growing narrower.
Next steps: coastline erosion notebook
The Coastal erosion notebook in this repository provides a simplified example of the method used to extract DEA Coastlines annual shoreline data. Run this notebook if you would like to generate more customised coastlines for a specific location, time period, epoch (e.g. annual or biennial coastlines) or tidal range (e.g. the position of the coastline at low, mid or high tide).
Note: This notebook currently supports extracting coastline data only, not generating rates of change statistics like those included in the DEA Coastlines product.
Additional information
License: The code in this notebook is licensed under the Apache License, Version 2.0. Digital Earth Australia data is licensed under the Creative Commons by Attribution 4.0 license.
Contact: If you need assistance, please post a question on the Open Data Cube Slack channel or on the GIS Stack Exchange using the open-data-cube tag (you can view previously asked questions here). If you would like to report an issue with this notebook, you can file one on
GitHub.
Last modified: December 2023
Tags
Tags: NCI compatible, sandbox compatible, DEA Coastlines, coastal erosion, widgets, ipyleaflet, no_testing