DEA Mangroves (Landsat)
DEA Mangroves (Landsat)
- Version:
- Type:
Derivative, Raster
- Resolution:
30 m
- Coverage:
1987 to 2024
- Data updates:
Yearly frequency, Ongoing
About
Digital Earth Australia (DEA) Mangroves classifies mangrove canopy cover density across Australia’s coastal ecosystems using 35+ years of Landsat data (1987–present) at 30-meter resolution. This dataset provides critical environmental intelligence for climate change monitoring, coastal protection planning, biodiversity conservation, and disaster response. By tracking mangrove health and extent over time, it enables assessment of how cyclones, sea level rise, and extreme weather events impact these critical carbon storage ecosystems, supporting evidence-based coastal management and conservation decisions. The ongoing maintenance and annual updates of this long-term monitoring resource advances scientific research and supports sustainable coastal management for public benefit.
This version includes breaking changes
All tile grid references have been changed to refer to a new origin point. Learn more in the Version 4.0.0 changelog.
Access the data
For help accessing the data, see the Access tab.
Key specifications
For more specifications, see the Specifications tab.
Technical name |
Geoscience Australia Mangrove Canopy Cover Collection 3 |
Bands |
|
DOI |
|
Currency |
|
Parent products |
DEA Fractional Cover Percentiles (Landsat), DEA Tasseled Cap Percentiles (Landsat) |
Collection |
|
Licence |
Cite this product
Data citation |
Lymburner, L., Lucas, R., Scarth, P., Alam, I., Phillips, C., Ticehurst, C., Held, A., Bunting, P. 2021. Geoscience Australia Mangrove Canopy Cover Collection 3. Geoscience Australia, Canberra. https://pid.geoscience.gov.au/dataset/ga/145497
|
Paper citation |
Lymburner, L., Bunting, P., Lucas, R., Scarth, P., Alam, I., Phillips, C., Ticehurst, C. and Held, A., 2020. Mapping the multi-decadal mangrove dynamics of the Australian coastline. Remote Sensing of Environment, 238, p.111185. https://doi.org/10.1016/j.rse.2019.05.004
|
Publications
Lymburner, L., Bunting, P., Lucas, R., Scarth, P., Alam, I., Phillips, C., Ticehurst, C., & Held, A. (2020). Mapping the multi-decadal mangrove dynamics of the Australian coastline. Remote Sensing of Environment, 238, 111185. https://doi.org/10.1016/j.rse.2019.05.004
Duke, N.C., Mackenzie, J.R., Canning, A.D., Hutley, L.B., Bourke, A.J., Kovacs, J.M., Cormier, R., Staben, G., Lymburner, L. and Ai, E., 2022. ENSO-driven extreme oscillations in mean sea level destabilise critical shoreline mangroves—An emerging threat. PLoS Climate, 1(8), p.e0000037.
Asbridge, E. et al. (2025) Characterising the short- and long-term impacts of tropical cyclones on mangroves using the Landsat archive. Cambridge Prisms: Coastal Futures, 3, p. e4. doi:10.1017/cft.2024.19.
Background
DEA Mangroves was developed to address the critical need for comprehensive, long-term monitoring of Australia’s mangrove ecosystems, which face increasing pressures from climate change, coastal development, and extreme weather events.
Applications
This dataset provides annual mangrove canopy density information across Australia’s entire coastline since 1987, offering valuable insights into ecosystem dynamics. The timeseries capabilities enable effective monitoring and quantification of mangrove canopy cover changes, supporting important conservation and management decisions. The extensive spatial and temporal coverage provides opportunities to understand how mangroves respond to major disturbance events such as severe tropical cyclones. These maps enhance our understanding of the vital ecosystem services that mangroves provide, including coastal protection, carbon storage, nursery grounds for commercially important fish and prawn species, and habitat for migratory and endemic bird species.
Technical Information
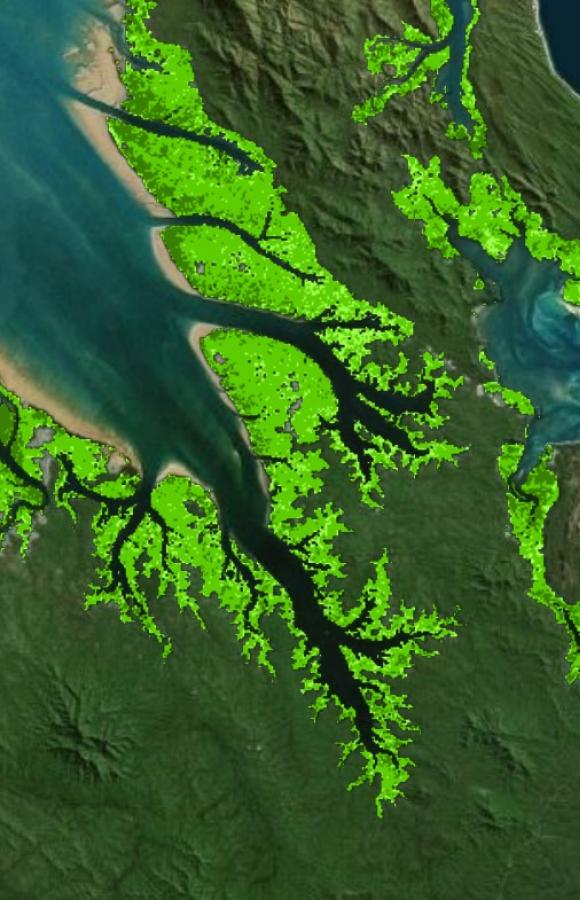
The DEA Mangroves product consists of 30 m resolution annual maps of mangrove canopy cover classes. Each annual map contains one layer (band) canopy_cover_class, with values defined as follows:
Not observed (grey) —
0: insufficient observations per year to determine if mangroves existWoodland 20-50% (pale green) —
1: mangroves present with Planimetric Canopy Cover Percentage (PCC%) between 20% and 50%Open forest 50-80% (mid green) —
2: mangroves present with PCC% between 50% and 80%Closed forest 80-100% (dark green) —
3: mangroves present with PCC% above 80%No data (transparent) —
255: no mangroves present, either PCC% below 20% or outside mangrove habitat
Lineage
The mangrove footprint is defined by combining the maximum spatial extent from two sources:
Global Mangrove Watch layers developed by the Japanese Aerospace Exploration Agency
State and Territory mangrove mapping products from Queensland, Northern Territory, and South Australia
This potential mangrove habitat is then refined using DEA Tasseled Cap Percentiles (specifically the wet_pc_10 band).
Mangrove canopy classification is performed using DEA Fractional Cover Percentiles bands:
pixels are classified by thresholding
pv_pc_10values (which serve as a proxy for PCC%) when quality assurance flagqa=2pixels are marked as
Not observedwhen quality assurance flagqa=1
Note: The maximum spatial extent remains consistent across all product versions. However, the mangrove habitat refinement and classification thresholds are updated and recalibrated for each version.
Processing Steps
The product development follows a three-stage methodology:
Stage 1: Determine the maximum spatial extent of mangroves
Establish the potential mangrove area by combining mangrove maps from multiple time periods (1996, 2007-2010, and 2015/16) generated through the Japanese Aerospace Exploration Agency (JAXA) Global Mangrove Watch (GMW).
Refine this combined map using State and Territory mangrove mapping products.
Stage 2: Calibrate thresholding values for mangrove canopy cover classes
Extract Planimetric Canopy Cover Percentage (PCC%) from high-resolution Light Detection and Ranging (LiDAR) data (1 m resolution).
Perform regression analysis between satellite-derived
pv_pc_10values and LiDAR-derived PCC% for corresponding locations and time periods.Determine the specific
pv_pc_10threshold values that correspond to 20%, 50%, and 80% PCC% levels.
Stage 3: Classify mangrove canopy density
Refine the mangrove footprint by applying
wet_pc_10thresholds within the maximum spatial extent established in Stage 1.Classify pixels within the refined mangrove footprint by applying the calibrated
pv_pc_10threshold values (from Stage 2) to assign appropriate canopy cover classes.Assign
Not observedclassification to pixels where the quality assurance flagqa=1indicates insufficient data quality.
Note:
Stage 1 is performed only once during initial product development to establish the maximum spatial extent.
Stage 2 is performed during major version upgrades to recalibrate threshold values.
Stage 3 (mangrove canopy density classification) is performed annually using the established thresholds to generate each year’s mangrove map from 1987 to present.
References
Lymburner, L., Bunting, P., Lucas, R., Scarth, P., Alam, I., Phillips, C., Ticehurst, C., & Held, A. (2020). Mapping the multi-decadal mangrove dynamics of the Australian coastline. Remote Sensing of Environment, 238, 111185. https://doi.org/10.1016/j.rse.2019.05.004
Accuracy
The accuracy limitations reported below are based on the DEA Landsat Collection 2 version 2.0.2 of the mangroves dataset. The current DEA Mangroves version 4.0.0 product uses input datasets from DEA Landsat Collection 3. The similarities and differences between these two foundation dataset collections can be reviewed here.
The primary changes affecting the Collection 3 mangroves product include:
Pixel resolution change from 25 m to 30 m.
Use of the updated Collection 3 Fractional Cover Percentiles data product.
Use of the updated Collection 3 Tasseled Cap Percentiles data product.
Due to the increased pixel spatial resolution, the reported accuracies and errors will be similar to those reported previously but not identical.
Calibration Updates
During the upgrade from Collection 2 to Collection 3, the thresholding values for mangrove canopy classes were recalibrated and adjusted to maintain consistency with the Collection 2 version of the product. The current threshold values are set at (14, 40, 62) for the pv_pc_10 parameter.
Known Limitations
The Global Mangrove Watch (GMW) polygon, created using methods described in Lucas et al. 2014, provides the consistent reference frame for this product. However, this reference dataset has inherent limitations that impact the DEA Mangroves product:
Omission errors: Areas that were mangrove habitat prior to 2010 but were not identified as mangrove in the 2010 GMW dataset may be excluded from the DEA Mangroves time series maps.
Commission errors: Some small areas of coastal non-mangrove woody vegetation (such as Casuarina and Melaleuca species) are incorrectly included within the GMW mangrove extent polygons. While efforts have been made to minimize these errors, some non-mangrove vegetation will still be classified as mangrove in the final product.
Quality Assurance
Product quality depends on the underlying Fractional Cover product quality. Quality issues occur during periods of limited satellite coverage.
Problem Periods:
2004-2010: Landsat 5 performance degradation.
2011-2012: Landsat 7 sensor failure.
Impact: Insufficient observations make 10th percentile calculations statistically unreliable, particularly in cloud-prone regions like the Wet Tropics where persistent cloud cover further reduces available data.
User Guidance: Exercise caution when interpreting mangrove classifications from 2004-2012, especially in high cloud frequency areas, as reduced observations may produce unreliable canopy cover estimates.
Product ID
The Product ID is ga_ls_mangrove_cover_cyear_3. This ID is used to load data from the Open Data Cube (ODC), for example dc.load(product="ga_ls_mangrove_cover_cyear_3", ...)
Bands
Bands are distinct layers of data within a product that can be loaded using the Open Data Cube (on the DEA Sandbox or NCI) or DEA’s STAC API. Note that the Coordinate Reference System (CRS) of these bands is GDA94 / Australian Albers (EPSG:3577).
Type |
Units |
Resolution |
No-data |
Aliases |
Description |
|
|---|---|---|---|---|---|---|
canopy_cover_class |
uint8 |
- |
30 m |
255 |
- |
The canopy cover classes are: Not observed (grey), 20-50% (pale green), 50-80% (mid green), 80-100% (dark green). |
For more information on these bands, see the Description tab.
Product information
This metadata provides general information about the product.
Product ID |
ga_ls_mangrove_cover_cyear_3
|
Used to load data from the Open Data Cube. |
Short name |
DEA Mangroves (Landsat) |
The name that is commonly used to refer to the product. |
Technical name |
Geoscience Australia Mangrove Canopy Cover Collection 3 |
The full technical name that refers to the product and its specific provider, sensors, and collection. |
Version |
4.0.0 |
The version number of the product. See the History tab. |
Lineage type |
Derivative |
Derivative products are derived from other products. |
Spatial type |
Raster |
Raster data consists of a grid of pixels. |
Spatial resolution |
30 m |
The size of the pixels in the raster. |
Temporal coverage |
1987 to 2024 |
The time span for which data is available. |
Coordinate Reference System (CRS) |
The method of mapping spatial data to the Earth’s surface. |
|
Update frequency |
Yearly |
The expected frequency of data updates. Also called ‘Temporal resolution’. |
Update activity |
Ongoing |
The activity status of data updates. |
Currency |
Currency is a measure based on data publishing and update frequency. |
|
Latest and next update dates |
See Table B of the report. |
|
DOI |
The Digital Object Identifier. |
|
Catalogue ID |
The Data and Publications catalogue (eCat) ID. |
|
Licence |
See the Credits tab. |
Product categorisation
This metadata describes how the product relates to other products.
Parent products |
DEA Fractional Cover Percentiles (Landsat), DEA Tasseled Cap Percentiles (Landsat) |
Collection |
|
Tags |
geoscience_australia_landsat_collection_3, forest, woodland, green, coast, coastal_ecosystem |
Access the data
DEA Maps |
Learn how to use DEA Maps. |
|
Digital Atlas applications |
Learn more about the Digital Atlas of Australia. |
|
DEA Explorer |
Learn how to use the DEA Explorer. |
|
Data sources |
Learn how to access the data via AWS. |
|
Code examples |
Learn how to use the DEA Sandbox. |
|
Web services |
Learn how to use DEA’s web services. |
|
Digital Atlas Layers |
Learn how to create a map using Digital Atlas. |
Version history
Versions are numbered using the Semantic Versioning scheme (Major.Minor.Patch). Note that this list may include name changes and predecessor products.
v4.0.0 |
- |
Current version |
v3.0.0 |
of |
|
v2.0.2 |
of |
Changelog
10 Sep 2025: DEA data in the Digital Atlas of Australia
The DEA Coastlines, DEA Mangroves, and DEA Water Observations Multi-Year Summary datasets have now been added to the Digital Atlas, joining DEA Land Cover. This integration marks a significant milestone in how DEA data can be accessed, visualised, and applied. By embedding DEA products into the Digital Atlas, users can now interact with trusted Earth observation datasets alongside other authoritative national data — unlocking powerful new opportunities for cross-sector analysis and decision-making.
30 Apr 2025: The 2024 annual data is now available
The 2024 annual data for this product was published on 30 April 2025. You are now able to access the latest data via DEA Maps and other methods. View the Tech Alert.
Version 4.0.0
Breaking change: Shift in grid origin point — The south-west origin point of the DEA Summary Product Grid has been shifted 18 tiles west and 15 tiles south. All tile grid references have changed (e.g.,
x10y10is nowx28y25). This affects all summary derivative products, but baseline and scene derivative products remain unaffected.Enhanced cloud masking to reduce noise — Cloud masking improvements use 6-pixel dilation on cloud and shadows to reduce noise in source datasets. Some high-reflectance areas (sand dunes, ocean) may show increased noise or data gaps, but these occurrences are infrequent with minimal impact.
Additional inputs from Landsat 9 — Landsat 9 data incorporated from 2022 onwards.
Acknowledgments
Landsat data is provided by the United States Geological Survey (USGS) through direct reception of the data at Geoscience Australias satellite reception facility or download.
The fractional cover algorithm was developed by the Joint Remote Sensing Research Program (JRSRP) and is described in Scarth et al. (2010). While originally calibrated in Queensland, a large collaborative effort between the Department of Agriculture, the Australian Bureau of Agricultural and Resource Economics (ABARES) and State and Territory governments to collect additional calibration data has enabled the calibration to extend to the entire Australian continent. DEA Fractional Cover was made possible by new scientific and technical capabilities, the collaborative framework established by the Terrestrial Ecosystem Research Network (TERN) through the National Collaborative Research Infrastructure Strategy (NCRIS), and collaborative effort between state and Commonwealth governments.
This product is the result of a collaboration between Geoscience Australia, the University of Aberyswyth, CSIRO, the Joint Remote Sensing Research Program and the Terrestrial Ecosystem Research Network.
License and copyright
© Commonwealth of Australia (Geoscience Australia).
Released under Creative Commons Attribution 4.0 International Licence.