DEA Wetlands Insight Tool (QLD)
DEA Wetlands Insight Tool (QLD)
Vector product
- Version:
- Type:
Data service, Vector
- Coverage:
1987 to 2021
- Data updates:
As needed, Ongoing
About
Our precious wetlands are dynamic and diverse environments. The Digital Earth Australia (DEA) Wetlands Insight Tool (Qld) gives visibility of changes to the amount of water, green vegetation, dry vegetation, and bare soil that have taken place in key Queensland wetlands since 1987.
Access the data
For help accessing the data, see the Access tab.
See it on a map
Access the data on AWS
Key specifications
For more specifications, see the Specifications tab.
Technical name |
Wetlands Insight Tool Queensland Wetlands Polygons |
Catalogue ID |
|
Parent product |
DEA Water Observations (Collection 2), DEA Fractional Cover (Collection 2), and Landsat 5, 7 and 8 NBART and Observational Attributes (Collection 2) |
Collection |
|
Licence |
Cite this product
Data citation |
Geoscience Australia, 2021. Wetlands Insight Tool Queensland Wetlands Polygons. Geoscience Australia, Canberra. https://pid.geoscience.gov.au/dataset/ga/144795
|
Paper citation |
Dunn, B., Ai, E., Alger, M.J., Fanson, B., Fickas, K.C., Krause, C.E., Lymburner, L., Nanson, R., Papas, P., Ronan, M., Thomas, R.F., 2023. Wetlands Insight Tool: Characterising the Surface Water and Vegetation Cover Dynamics of Individual Wetlands Using Multidecadal Landsat Satellite Data. Wetlands 43, 37. https://doi.org/10.1007/s13157-023-01682-7
|
Publications
Dunn, B., Ai, E., Alger, M.J., Fanson, B., Fickas, K.C., Krause, C.E., Lymburner, L., Nanson, R., Papas, P., Ronan, M., Thomas, R.F., 2023. Wetlands Insight Tool: Characterising the Surface Water and Vegetation Cover Dynamics of Individual Wetlands Using Multidecadal Landsat Satellite Data. Wetlands 43, 37. https://doi.org/10.1007/s13157-023-01682-7
Background
Wetlands provide a wide range of ecosystem services including improving water quality, carbon sequestration, as well as providing habitat for fish, amphibians, reptiles and birds. Managing wetlands in Australia is challenging due to competing pressures for water availability and highly variable climatic settings. The Wetlands Insight Tool (QLD) has been developed to provide catchment managers, environmental water holders, and wetlands scientists a consistent historical baseline of wetlands dynamics from 1987 onwards. The Wetlands Insight Tool (QLD) is available online through the Queensland Government WetlandInfo website.
What this product offers
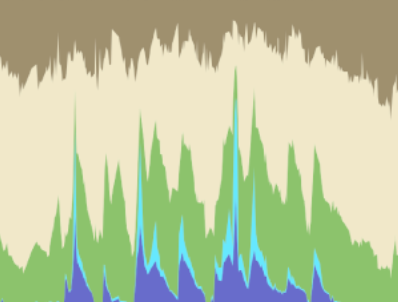
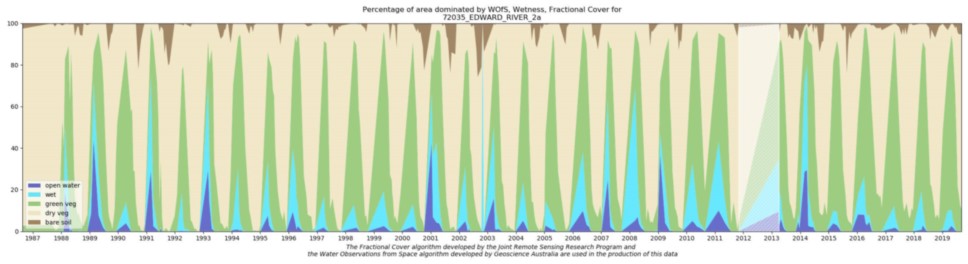
The Wetlands Insight Tool (QLD) summarises how the amount of water, green vegetation, dry vegetation and bare soil varies over time within each wetland. It provides the user with the ability to compare how the wetland is behaving now with how it has behaved in the past. This allows users to identify how changes in water availability have affected the wetland. It achieves this by presenting a combined view of Water Observations from Space, Tasseled Cap Wetness and Fractional Cover measurements from the Landsat series of satellites, summarised as a stacked line plot to show how that wetland has changed over time.

Applications
The product is designed to support QLD wetland managers, catchment managers and environmental waterholders in understanding whether or not wetlands are changing over time. In instances where the wetlands are changing, the tool allows users to identify whether the changes are gradual, rapid, once-off or cyclical in nature. For example the response of wetlands to the following drivers can be assessed:
Changes in river flow volumes
Changes in flood frequency
Long term shifts in rainfall
Wet-season/Dry-season shifts in water availability
Invasive weeds
Environmental watering events
Care should be used when interpreting Wetlands Insight Tool (QLD) results as increases/decreases in particular cover types can be associated with different processes. For example an increase in green cover could indicate canopy recovery of desirable wetland species or an increase in the amount of invasive weeds.
Technical information
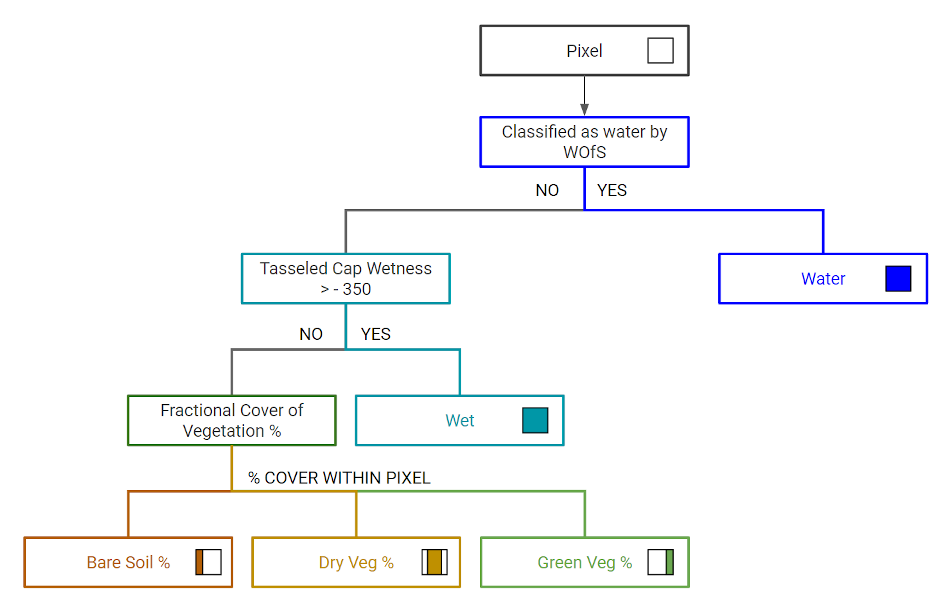
Every pixel within a wetland polygon is evaluated using this decision tree at every time step, and the results are tabulated to create the input data to the stacked line plot for that wetland.
Lineage
The code base used to generate the QLD Wetlands Insight Tool results is available at GeoscienceAustralia/wit_tooling
References
Scarth, P., Röder, A., Schmidt, M., 2010. Tracking grazing pressure and climate interaction - the role of Landsat fractional cover in time series analysis. In: Proceedings of the 15th Australasian Remote Sensing and Photogrammetry Conference (ARSPC), 13-17 September, Alice Springs, Australia. Alice Springs, NT.
Guerschman, J.P., Scarth, P.F., McVicar, T.R., Renzullo, L.J., Malthus, T.J., Stewart, J.B., Rickards, J.E., & Trevithick, R. (2015). Assessing the effects of site heterogeneity and soil properties when unmixing photosynthetic vegetation, non-photosynthetic vegetation and bare soil fractions from Landsat and MODIS data. Remote Sensing of Environment, 161, 12-26, https://doi.org/10.1016/j.rse.2015.01.021
Muir, J., Schmidt, M., Tindall, D., Trevithick, R., Scarth, P., Stewart, J., 2011. Guidelines for Field measurement of fractional ground cover: a technical handbook supporting the Australian collaborative land use and management program. Tech. rep., Queensland Department of Environment and Resource Management for the Australian Bureau of Agricultural and Resource Economics and Sciences, Canberra.
Mueller, N., Lewis, A. Roberts, D., Ring, S., Melrose, R., Sixsmith, J., Lymburner, L., McIntyre, A., Tan, P., Curnow, S. and Ip, A.(2016) ‘Water observations from space: Mapping surface water from 25 years of Landsat imagery across Australia’, Remote Sensing of Environment, 174, 341-352, https://doi.org/10.1016/j.rse.2015.11.003
Crist, E.P. (1985) ‘A TM Tasseled Cap equivalent transformation for reflectance factor data’, Remote Sensing of Environment, 17(3), 301-306, https://doi.org/10.1016/0034-4257(85)90102-6
Accuracy
The accuracy of the stacked line plots is dependent on the accuracy of the underlying algorithms: Water Observations from Space (Mueller et al. 2016) and the Joint Remote Sensing Research Program’s Fractional Cover algorithm (Scarth et al. 2010).
The Tasseled Cap Wetness threshold used in the Wetlands Insight Tool has been compared with independent inundation data for one major wetland complex, however the Tasseled Cap Wetness index may under or overestimate the actual extent of inundation for individual wetlands. The use of a consistent threshold means that the ‘precision’ is high, insofar as you’re measuring the same aspect of the wetland at each point in time, however the accuracy with which Tasseled Cap Wetness measures free water underneath/within wetland vegetation is not quantified.
The interpretability of the results for each polygon is dependent on the accuracy of the linework that has been used to create that polygon.
The 30 metre resolution of Landsat imposes an intrinsic limitation on the Wetlands Insight Tool. Wetland areas that are small, or long and narrow in nature are likely to be inaccurate (due to inclusion of neighbouring non-wetland pixels) or difficult to interpret (stack line plots for areas with a small number of pixels have sharp steps in them).
The period of time between when Landsat 5 ceased operations (November 2011) and Landsat 8 data became routinely available (May 2013) is likely to be inaccurate. There will be some wetlands, close the centre of Landsat paths where Landsat 7 continued to capture suitable (gap free) data, however it is safer, as a general rule, to consider this period as ‘low data quality’.
Quality assurance
Quality assurance was undertaken to ensure that a Wetlands Insight Tool stacked line plot was generated for every polygon in the QLD WetlandInfo polygon set.
Product information
This metadata provides general information about the product.
Short name |
DEA Wetlands Insight Tool (QLD) |
The name that is commonly used to refer to the product. |
Technical name |
Wetlands Insight Tool Queensland Wetlands Polygons |
The full technical name that refers to the product and its specific provider, sensors, and collection. |
Version |
1.0.0 |
The version number of the product. |
Lineage type |
Data service |
Our standard lineage types are ‘Baseline’ and ‘Derivative’. |
Spatial type |
Vector |
Vector data consists of spatial polygons, lines, and points. |
Temporal coverage |
1987 to 2021 |
The time span for which data is available. |
Coordinate Reference System (CRS) |
The method of mapping spatial data to the Earth’s surface. |
|
Update frequency |
As needed |
The expected frequency of data updates. Also called ‘Temporal resolution’. |
Update activity |
Ongoing |
The activity status of data updates. |
Catalogue ID |
The Data and Publications catalogue (eCat) ID. |
|
Licence |
See the Credits tab. |
Product categorisation
This metadata describes how the product relates to other products.
Parent product |
DEA Water Observations (Collection 2), DEA Fractional Cover (Collection 2), and Landsat 5, 7 and 8 NBART and Observational Attributes (Collection 2) |
Collection |
|
Tags |
geoscience_australia_landsat_collection_2_deprecated, landsat, wetlands, tasseled_cap |
Access the data
DEA Maps |
Learn how to use DEA Maps. |
|
Data sources |
Learn how to access the data via AWS. |
How to access the data via QLD Government
Information on how to access the Wetlands Insight Tool using the QLD WetlandMaps service can be found on this page:
WetlandMaps interactive online maps and data can be accessed via this link:
The QLD Wetland management resource portal WetlandInfo can be found here:
Version history
No previous versions are available.
Acknowledgments
The Queensland Government Department of Environment and Science wetlands team promotes and delivers wetlands tools and information, enabling the delivery of Geoscience Australia DEA Wetlands Tool (QLD) capabilities.
The Fractional cover (v2) algorithm is provided courtesy of the Joint Remote Sensing Research Program. The development of the algorithm was supported by field data collection by Australian State and Territory agencies, TERN and the National Ground Cover Monitoring Program, coordinated by ABARES.
License and copyright
© Commonwealth of Australia (Geoscience Australia).
Released under Creative Commons Attribution 4.0 International Licence.