DEA Water Observations Statistics (Landsat)
DEA Water Observations Statistics (Landsat)
ga_ls_wo_fq_apr_oct_3, ga_ls_wo_fq_nov_mar_3, ga_ls_wo_fq_cyear_3, ga_ls_wo_fq_myear_3
- Version:
- Type:
Derivative, Raster
- Resolution:
30 m
- Coverage:
1986 to March 2025
- Data updates:
Yearly frequency, Ongoing
About
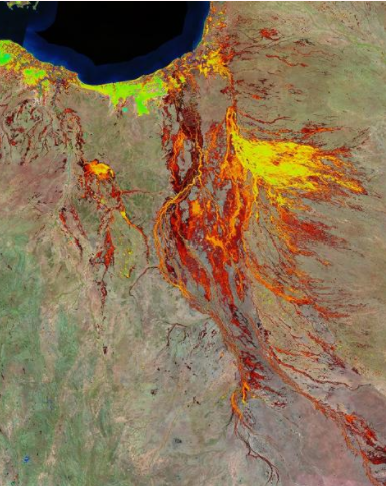
Digital Earth Australia (DEA) Water Observations uses an algorithm to classify each pixel from Landsat satellite imagery as ‘wet’, ‘dry’ or ‘invalid’. Combining the classified pixels into summaries, covering a year, season, or all of time (since 1986) gives the information on where water is usually, and where it is rarely.
This version includes breaking changes
All tile grid references have been changed to refer to a new origin point. Learn more in the Version 2.0.0 changelog.
Access the data
For help accessing the data, see the Access tab.
Key specifications
For more specifications, see the Specifications tab.
Technical name |
Geoscience Australia Landsat Water Observation Statistics Collection 3 |
Bands |
|
DOI |
|
Currency |
|
Parent product |
|
Collection |
|
Licence |
Cite this product
Data citation |
Mueller, N. 2022. Geoscience Australia Landsat Water Observation Statistics Collection 3. Geoscience Australia, Canberra. https://dx.doi.org/10.26186/146091
|
Publications
Mueller, N., Lewis, A., Roberts, D., Ring, S., Melrose, R., Sixsmith, J., Lymburner, L., McIntyre, A., Tan, P., Curnow, S., & Ip, A. (2016). Water observations from space: Mapping surface water from 25 years of Landsat imagery across Australia. Remote Sensing of Environment, 174, 341–352. https://doi.org/10.1016/j.rse.2015.11.003
Background
These are the statistics generated from the DEA Water Observations (Water Observations from Space) suite of products, which gives summaries of how often surface water was observed by the Landsat satellites for various periods (per year, per season and for the period from 1986 to the present).
Water Observations Statistics (WO-STATS) provides information on how many times the Landsat satellites were able to clearly see an area, how many times those observations were wet, and what that means for the percentage of time that water was observed in the landscape.
What this product offers
Each dataset in this product consists of the following datasets:
Clear Count: how many times an area could be clearly seen (i.e. not affected by clouds, shadows or other satellite observation problems)
Wet Count: how many times water was detected in observations that were clear
Water Frequency: what percentage of clear observations were detected as wet (i.e. the ratio of wet to clear as a percentage)
Applications
Helps understand where flooding may have occurred in the past, to inform emergency management and risk assessment.
Provides an indication of the permanence of surface water in the Australian landscape by showing where water is observed rarely in comparison to where it is often observed, informing water management and mapping.
Can assist with wetland analyses, water connectivity and surface-ground water relationships.
The annual product provides information on how surface water changes per year across Australia, and is useful for drought analysis.
The seasonal product is useful for understanding the differences in water availability between the summer and winter periods across Australia.
Technical information
As no confidence filtering is applied to this product, it is affected by noise where misclassifications have occurred in the input water classifications, and can be difficult to interpret on its own.
WO-STATS is available in multiple forms, depending on the length of time over which the statistics are calculated. At present the following are available:
DEA WO Multi-Year:
ga_ls_wo_fq_myear_3: statistics calculated from the full depth of time series (1986 to 2023) unfilteredDEA WO Calendar Year:
ga_ls_wo_fq_cyear_3: statistics calculated from each calendar year (1986 to 2024)DEA WO November to March:
ga_ls_wo_fq_nov_mar_3: statistics calculated yearly from November to March (1986 to 2025)DEA WO April to October:
ga_ls_wo_fq_apr_oct_3: statistics calculated yearly from April to October (1986 to 2024)
In addition, a confidence-filtered Multi-Year Summary is under development, which will contain a confidence layer and subsequent filtered water frequency layer. This provides a noise-reduced view of the unfiltered multi-year summary.
Note
When loading the data of any Water Observations summary using the datacube Python library or when using DEA Maps, the central date of the observation period is returned. This date typically corresponds to:
15 January for the November to March season
16 July for the April to October season
2 July for calendar year summaries
For example, the November to March 2020–2021 season is reported with a central date of 15 January 2021.
Lineage
This product is created from the WO water classification (Water Observations (Landsat)). Every pixel location is analysed statistically to derive the count of clear observations, the count of clear-wet observations and then to calculate the percentage of clear observations that were also wet. This provides a ‘normalised’ water frequency product for all of Australia.
Each product within the WO-STATS set is derived from the available Landsat observations within the respective period: calendar years; Apr-Oct each year; Nov-Mar each year; all-of-time (first available Landsat observation in the DEA archive to the most recent).
To create the confidence layer required for the filtered product, a logistic regression is created between the un-filtered product and information about terrain, built-up areas, and coarse national water observations. In this way the confidence reflects the likelihood that the observed water is scientifically feasible at every pixel.
Processing steps
Calculation of clear count, wet count and water summary (percentage of clear observations that are wet).
For each WO pixel through time:
count the number of clear observations (ie observations not masked by pixel quality for cloud, shadows or sensor issues) to produce clear count dataset;
count the number of clear observations that are wet to produce wet count dataset;
create the ratio of wet to clear from the wet and clear count datasets and produce as a percentage dataset.
References
Mueller, N., Lewis, A., Roberts, D., Ring, S., Melrose, R., Sixsmith, J., Lymburner, L., McIntyre, A., Tan, P., Curnow, S., & Ip, A. (2016). Water observations from space: Mapping surface water from 25 years of Landsat imagery across Australia. Remote Sensing of Environment, 174, 341–352. https://doi.org/10.1016/j.rse.2015.11.003
Accuracy
Please refer to the Landsat Surface Reflectance Product Description for the accuracy and limitations of the atmospheric, BRDF and topographic shading processing sequence. Please refer to Mueller et al. 2016 for details on the accuracy and limitations of Water Observations from Space (WOfS and WOfS-STATS).
WO-STATS provides a summary of water classification results from the WOfS product for all of Australia. As it cannot perfectly filter out misclassifications due to clouds, cloud shadows and issues to do with satellite sensor problems (such as the Landsat 7 SLC-Off failure), the summary also contains these misclassifications. In general misclassifications occur in the very low frequency observations and so can cause a misrepresentation of flooded areas. Misclassifications can also be caused by the presence of vegetation covering the water or within the water.
Product IDs
The Product IDs are ga_ls_wo_fq_apr_oct_3, ga_ls_wo_fq_nov_mar_3, ga_ls_wo_fq_cyear_3, and ga_ls_wo_fq_myear_3. These IDs are used to load data from the Open Data Cube (ODC), for example dc.load(product="ga_ls_wo_fq_apr_oct_3", ...)
Bands
Bands are distinct layers of data within a product that can be loaded using the Open Data Cube (on the DEA Sandbox or NCI) or DEA’s STAC API. Note that the Coordinate Reference System (CRS) of these bands is GDA94 / Australian Albers (EPSG:3577).
Type |
Units |
Resolution |
No-data |
Aliases |
Description |
|
|---|---|---|---|---|---|---|
count_wet |
int16 |
- |
30 m |
-999 |
- |
Wet Count: how many times water was detected in observations that were clear. |
count_clear |
int16 |
- |
30 m |
-999 |
- |
Clear Count: how many times an area could be clearly seen. |
frequency |
float32 |
- |
30 m |
NaN |
- |
Water Frequency: what percentage of clear observations were detected as wet. |
For more information on these bands, see the Description tab.
Product information
This metadata provides general information about the product.
Product IDs |
ga_ls_wo_fq_apr_oct_3
ga_ls_wo_fq_nov_mar_3
ga_ls_wo_fq_cyear_3
ga_ls_wo_fq_myear_3
|
Used to load data from the Open Data Cube. |
Short name |
DEA Water Observations Statistics (Landsat) |
The name that is commonly used to refer to the product. |
Technical name |
Geoscience Australia Landsat Water Observation Statistics Collection 3 |
The full technical name that refers to the product and its specific provider, sensors, and collection. |
Version |
2.0.0 |
The version number of the product. See the History tab. |
Lineage type |
Derivative |
Derivative products are derived from other products. |
Spatial type |
Raster |
Raster data consists of a grid of pixels. |
Spatial resolution |
30 m |
The size of the pixels in the raster. |
Temporal coverage |
1986 to March 2025 |
The time span for which data is available. |
Coordinate Reference System (CRS) |
The method of mapping spatial data to the Earth’s surface. |
|
Update frequency |
Yearly |
The expected frequency of data updates. Also called ‘Temporal resolution’. |
Update activity |
Ongoing |
The activity status of data updates. |
Currency |
Currency is a measure based on data publishing and update frequency. |
|
Latest and next update dates |
See Table B of the report. |
|
DOI |
The Digital Object Identifier. |
|
Catalogue ID |
The Data and Publications catalogue (eCat) ID. |
|
Licence |
See the Credits tab. |
Product categorisation
This metadata describes how the product relates to other products.
Parent product |
|
Collection |
|
Tags |
geoscience_australia_landsat_collection_3, surface_water, water_detection, floods, wetlands |
Access the data
DEA Maps |
Learn how to use DEA Maps. |
|
Digital Atlas applications |
Learn more about the Digital Atlas of Australia. |
|
DEA Explorer |
Learn how to use the DEA Explorer. |
|
Data sources |
Learn how to access the data via AWS. |
|
Code examples |
Learn how to use the DEA Sandbox. |
|
Web services |
Learn how to use DEA’s web services. |
|
Digital Atlas Layers |
Learn how to create a map using Digital Atlas. |
Access constraints
How to access the data
To view and access the data interactively:
Visit DEA Maps.
Click
Explore map data.Select
Inland water>DEA Water Observations.Select which products you would like to display and click
Add to the map.
Version history
Versions are numbered using the Semantic Versioning scheme (Major.Minor.Patch). Note that this list may include name changes and predecessor products.
v2.0.0 |
- |
Current version |
v1.6.0 |
of |
Changelog
10 Sep 2025: DEA data in the Digital Atlas of Australia
The DEA Coastlines, DEA Mangroves, and DEA Water Observations Multi-Year Summary datasets have now been added to the Digital Atlas, joining DEA Land Cover. This integration marks a significant milestone in how DEA data can be accessed, visualised, and applied. By embedding DEA products into the Digital Atlas, users can now interact with trusted Earth observation datasets alongside other authoritative national data — unlocking powerful new opportunities for cross-sector analysis and decision-making.
Apr-Jun 2025: Latest updates
Water Observation Statistics (Annual) – This product was updated with the 2024 calendar year data in April 2025.
Water Observation Statistics (Apr – Oct) – This product was updated with seasonal data (period: April 2024 to October 2024) in April 2025.
Water Observation Statistics (Nov – Mar) – This product was updated with seasonal data (period: November 2024 to March 2025) in June 2025.
Version 2.0.0 released
Breaking change: Shift in grid origin point — The south-west origin point of the DEA Summary Product Grid has been shifted 18 tiles west and 15 tiles south. Therefore, all tile grid references have been changed. For instance, a tile reference of
x10y10has changed tox28y25. The tile grid references of all derivative products generated from 2024 onwards will also be changed; however, Analysis Ready Data products will not be affected.Enhanced cloud masking to reduce noise — An enhancement to cloud masking has reduced cloud and shadow noise. This enhancement (known as ‘cloud buffering’) involved cleaning cloud masks using a 6-pixel dilation on cloud and shadows. Note that some areas of very high surface reflectance (e.g. sand dunes and ocean areas) may exhibit worsened noise or data gaps, but these are infrequent occurrences with low impact.
Landsat 9 product — Landsat 9 is processed from 2022 onwards.
2024-01-24: Water Observations 2023 annual summary released
Product id: ga_ls_wo_fq_cyear_3
To access the updated product, see the Access tab.
License and copyright
© Commonwealth of Australia (Geoscience Australia).
Released under Creative Commons Attribution 4.0 International Licence.
The code for DEA-WO and its derivatives is available through GitHub under Apache 2.0 Open licensing.