Introduction to products and measurements 
Sign up to the DEA Sandbox to run this notebook interactively from a browser
Compatibility: Notebook currently compatible with both the
NCIandDEA SandboxenvironmentsProducts used: ga_ls5t_ard_3
Prerequisites: Users of this notebook should have a basic understanding of:
How to run a Jupyter notebook
The basic structure of the DEA satellite datasets
Background
A “datacube” is a digital information architecture that specialises in hosting and cataloguing spatial information. Digital Earth Australia (DEA) is based on the Open Data Cube infrastructure, and specialises in storing remotely sensed data, particularly from Earth Observation satellites such as Landsat and Sentinel-2.
The DEA datacube contains both raw satellite data and derivative data “products”. These data products are often composed of a range of “measurements” such as the suite of remote sensing band values or statistical product summaries. Before running a query to load data from the datacube, it is useful to know what it contains. This notebook demonstrates several straightforward ways to inspect the product and measurement contents of a datacube.
Description
This notebook demonstrates how to connect to a datacube and interrogate the available products and measurements stored within. Topics covered include:
How to connect to a datacube
How to list all the products
How to list all the product measurements
How to interactively visualise data in the datacube
Getting started
To run this introduction to products and measurements, run all the cells in the notebook starting with the “Load packages” cell. For help with running notebook cells, refer back to the Jupyter Notebooks notebook.
Load packages
The datacube package is required to access and work with available data. The pandas package is required to format tables. The DcViewer utility provides an interface for interactively exploring the products available in the datacube.
[1]:
import datacube
import pandas as pd
from odc.ui import DcViewer

# Set some configurations for displaying tables nicely
pd.set_option("display.max_colwidth", 200)
pd.set_option("display.max_rows", None)
Connect to the datacube
After importing the datacube package, users need to specify a name for their session, known as the app name.
This name is generated by the user and is used to track down issues with database queries. It does not have any effect on the analysis. Use a short name that is consistent with the purpose of your notebook such as the way 03_Products_and_measurements has been used as the app name in this notebook.
The resulting dc object provides access to all the data contained within the Digital Earth Australia datacube.
[2]:
dc = datacube.Datacube(app="03_Products_and_measurements")
List products
Once a datacube instance has been created, users can explore the products and measurements stored within.
The following cell lists all products that are currently available in the DEA datacube by using the dc.list_products() function.
Products listed under name in the following table represent the product options available when querying the datacube. The table below provides some useful information about each product, including a brief product description, the data’s license, and the product’s default crs (coordinate reference system) and resolution if applicable.
For a comprehensive product description and access to complete product metadata, users are directed to the Geoscience Australia `Content Management Interface <>`__
[3]:
products = dc.list_products()
products
[3]:
| name | description | license | default_crs | default_resolution | |
|---|---|---|---|---|---|
| name | |||||
| aster_aloh_group_composition | aster_aloh_group_composition | ASTER | None | None | None |
| aster_aloh_group_content | aster_aloh_group_content | ASTER | None | None | None |
| aster_false_colour | aster_false_colour | ASTER | None | None | None |
| aster_feoh_group_content | aster_feoh_group_content | ASTER | None | None | None |
| aster_ferric_oxide_composition | aster_ferric_oxide_composition | ASTER | None | None | None |
| aster_ferric_oxide_content | aster_ferric_oxide_content | ASTER | None | None | None |
| aster_ferrous_iron_content_in_mgoh | aster_ferrous_iron_content_in_mgoh | ASTER | None | None | None |
| aster_ferrous_iron_index | aster_ferrous_iron_index | ASTER | None | None | None |
| aster_green_vegetation | aster_green_vegetation | ASTER | None | None | None |
| aster_gypsum_index | aster_gypsum_index | ASTER | None | None | None |
| aster_kaolin_group_index | aster_kaolin_group_index | ASTER | None | None | None |
| aster_mgoh_group_composition | aster_mgoh_group_composition | ASTER | None | None | None |
| aster_mgoh_group_content | aster_mgoh_group_content | ASTER | None | None | None |
| aster_opaque_index | aster_opaque_index | ASTER | None | None | None |
| aster_quartz_index | aster_quartz_index | ASTER | None | None | None |
| aster_regolith_ratios | aster_regolith_ratios | ASTER | None | None | None |
| aster_silica_index | aster_silica_index | ASTER | None | None | None |
| cemp_insar_alos_displacement | cemp_insar_alos_displacement | CEMP InSAR ALOS Displacement | None | None | None |
| cemp_insar_alos_velocity | cemp_insar_alos_velocity | CEMP InSAR ALOS Velocity | None | None | None |
| cemp_insar_envisat_displacement | cemp_insar_envisat_displacement | CEMP InSAR Envisat Displacement | None | None | None |
| cemp_insar_envisat_velocity | cemp_insar_envisat_velocity | CEMP InSAR Envisat Velocity | None | None | None |
| cemp_insar_radarsat2_displacement | cemp_insar_radarsat2_displacement | CEMP InSAR Radarsat-2 Displacement | None | None | None |
| cemp_insar_radarsat2_velocity | cemp_insar_radarsat2_velocity | CEMP InSAR Radarsat-2 Velocity | None | None | None |
| fc_percentile_albers_annual | fc_percentile_albers_annual | Landsat Fractional Cover percentile 25 metre, 100km tile, Australian Albers Equal Area projection (EPSG:3577) | None | None | None |
| fc_percentile_albers_seasonal | fc_percentile_albers_seasonal | Landsat Fractional Cover percentile 25 metre, 100km tile, Australian Albers Equal Area projection (EPSG:3577) | None | None | None |
| ga_ls5t_ard_3 | ga_ls5t_ard_3 | Geoscience Australia Landsat 5 Thematic Mapper Analysis Ready Data Collection 3 | CC-BY-4.0 | None | None |
| ga_ls5t_nbart_gm_cyear_3 | ga_ls5t_nbart_gm_cyear_3 | Geoscience Australia Landsat Nadir BRDF Adjusted Reflectance Terrain, Landsat 5 Geomedian Calendar Year Collection 3 | None | None | None |
| ga_ls7e_ard_3 | ga_ls7e_ard_3 | Geoscience Australia Landsat 7 Enhanced Thematic Mapper Plus Analysis Ready Data Collection 3 | CC-BY-4.0 | None | None |
| ga_ls7e_ard_provisional_3 | ga_ls7e_ard_provisional_3 | Geoscience Australia Landsat 7 Enhanced Thematic Mapper Plus Analysis Ready Data Collection 3 (provisional) | CC-BY-4.0 | None | None |
| ga_ls7e_nbart_gm_cyear_3 | ga_ls7e_nbart_gm_cyear_3 | Geoscience Australia Landsat Nadir BRDF Adjusted Reflectance Terrain, Landsat 7 Geomedian Calendar Year Collection 3 | None | None | None |
| ga_ls8c_ard_3 | ga_ls8c_ard_3 | Geoscience Australia Landsat 8 Operational Land Imager and Thermal Infra-Red Scanner Analysis Ready Data Collection 3 | CC-BY-4.0 | None | None |
| ga_ls8c_ard_provisional_3 | ga_ls8c_ard_provisional_3 | Geoscience Australia Landsat 8 Operational Land Imager and Thermal Infra-Red Scanner Analysis Ready Data Collection 3 (provisional) | CC-BY-4.0 | None | None |
| ga_ls8c_nbart_gm_cyear_3 | ga_ls8c_nbart_gm_cyear_3 | Geoscience Australia Landsat Nadir BRDF Adjusted Reflectance Terrain, Landsat 8 Geomedian Calendar Year Collection 3 | None | None | None |
| ga_ls9c_ard_3 | ga_ls9c_ard_3 | Geoscience Australia Landsat 9 Operational Land Imager and Thermal Infra-Red Scanner Analysis Ready Data Collection 3 | CC-BY-4.0 | None | None |
| ga_ls_fc_3 | ga_ls_fc_3 | Geoscience Australia Landsat Fractional Cover Collection 3 | CC-BY-4.0 | None | None |
| ga_ls_fc_pc_cyear_3 | ga_ls_fc_pc_cyear_3 | Geoscience Australia Landsat Fractional Cover Percentile Calendar Year Collection 3 | CC-BY-4.0 | None | None |
| ga_ls_landcover_class_cyear_2 | ga_ls_landcover_class_cyear_2 | Geoscience Australia Landsat Land Cover Calendar Year Collection 2.0 | None | None | None |
| ga_ls_mangrove_cover_cyear_3 | ga_ls_mangrove_cover_cyear_3 | Geoscience Australia Landsat Mangrove Cover Calendar Year Collection 3 | CC-BY-4.0 | None | None |
| ga_ls_tc_pc_cyear_3 | ga_ls_tc_pc_cyear_3 | Geoscience Australia Landsat Tasseled Cap Percentile Calendar Year Collection 3 | CC-BY-4.0 | None | None |
| ga_ls_tcw_percentiles_2 | ga_ls_tcw_percentiles_2 | Geoscience Australia Landsat Tasseled Cap Wetness Percentiles Collection 2, 25 metre, 100km tile, Australian Albers Equal Area projection (EPSG:3577) | None | None | None |
| ga_ls_wo_3 | ga_ls_wo_3 | Geoscience Australia Landsat Water Observations Collection 3 | CC-BY-4.0 | None | None |
| ga_ls_wo_fq_apr_oct_3 | ga_ls_wo_fq_apr_oct_3 | Geoscience Australia Landsat Water Observations Frequency April to October Collection 3 | None | None | None |
| ga_ls_wo_fq_cyear_3 | ga_ls_wo_fq_cyear_3 | Geoscience Australia Landsat Water Observations Frequency Calendar Year Collection 3 | None | None | None |
| ga_ls_wo_fq_myear_3 | ga_ls_wo_fq_myear_3 | Geoscience Australia Landsat Water Observations Frequency Multi Year Collection 3 | None | None | None |
| ga_ls_wo_fq_nov_mar_3 | ga_ls_wo_fq_nov_mar_3 | Geoscience Australia Landsat Water Observations Frequency November to March Collection 3 | None | None | None |
| ga_s2am_ard_3 | ga_s2am_ard_3 | Geoscience Australia Sentinel 2A MSI Analysis Ready Data Collection 3 | CC-BY-4.0 | None | None |
| ga_s2am_ard_3 | ga_s2am_ard_3 | Geoscience Australia Sentinel 2a MSI Analysis Ready Data Collection 3 (provisional) | CC-BY-4.0 | None | None |
| ga_s2_ba_provisional_3 | ga_s2_ba_provisional_3 | Sentinel 2 Burnt Area Collection 3 (Provisional) | CC-BY-4.0 | None | None |
| ga_s2bm_ard_3 | ga_s2bm_ard_3 | Geoscience Australia Sentinel 2B MSI Analysis Ready Data Collection 3 | CC-BY-4.0 | None | None |
| ga_s2bm_ard_3 | ga_s2bm_ard_3 | Geoscience Australia Sentinel 2b MSI Analysis Ready Data Collection 3 (provisional) | CC-BY-4.0 | None | None |
| ga_srtm_dem1sv1_0 | ga_srtm_dem1sv1_0 | DEM 1sec Version 1.0 | None | EPSG:4326 | (-0.00027777777778, 0.00027777777778) |
| geodata_coast_100k | geodata_coast_100k | Coastline data for Australia | None | None | None |
| high_tide_comp_20p | high_tide_comp_20p | High tide 20 percentage composites 25m v. 2.0.0 | None | EPSG:3577 | (-25, 25) |
| item_v2 | item_v2 | Relative Extents Model | None | EPSG:3577 | (-25, 25) |
| item_v2_conf | item_v2_conf | Average ndwi Standard Deviation, the Confidence Layer | None | EPSG:3577 | (-25, 25) |
| landsat_barest_earth | landsat_barest_earth | Landsat-5/Landsat-7/Landsat-8 combined Barest Earth pixel composite albers 25 metre, 100km tile, Australian Albers Equal Area projection (EPSG:3577) | None | None | None |
| low_tide_comp_20p | low_tide_comp_20p | Low tide 20 percentage composites 25m v. 2.0.0 | None | EPSG:3577 | (-25, 25) |
| ls5_fc_albers | ls5_fc_albers | Landsat 5 Fractional Cover 25 metre, 100km tile, Australian Albers Equal Area projection (EPSG:3577) | None | None | None |
| ls5_nbart_geomedian_annual | ls5_nbart_geomedian_annual | Surface Reflectance Geometric Median 25 metre, 100km tile, Australian Albers Equal Area projection (EPSG:3577) | None | None | None |
| ls5_nbart_tmad_annual | ls5_nbart_tmad_annual | Surface Reflectance Triple Median Absolute Deviation 25 metre, 100km tile, Australian Albers Equal Area projection (EPSG:3577) | None | None | None |
| ls7_fc_albers | ls7_fc_albers | Landsat 7 Fractional Cover 25 metre, 100km tile, Australian Albers Equal Area projection (EPSG:3577) | None | EPSG:3577 | (-25, 25) |
| ls7_nbart_geomedian_annual | ls7_nbart_geomedian_annual | Surface Reflectance Geometric Median 25 metre, 100km tile, Australian Albers Equal Area projection (EPSG:3577) | None | None | None |
| ls7_nbart_tmad_annual | ls7_nbart_tmad_annual | Surface Reflectance Triple Median Absolute Deviation 25 metre, 100km tile, Australian Albers Equal Area projection (EPSG:3577) | None | None | None |
| ls8_barest_earth_albers | ls8_barest_earth_albers | Landsat-8 Barest Earth pixel composite albers 25 metre, 100km tile, Australian Albers Equal Area projection (EPSG:3577) | None | None | None |
| ls8_fc_albers | ls8_fc_albers | Landsat 8 Fractional Cover 25 metre, 100km tile, Australian Albers Equal Area projection (EPSG:3577) | None | EPSG:3577 | (-25, 25) |
| ls8_nbart_geomedian_annual | ls8_nbart_geomedian_annual | Surface Reflectance Geometric Median 25 metre, 100km tile, Australian Albers Equal Area projection (EPSG:3577) | None | None | None |
| ls8_nbart_tmad_annual | ls8_nbart_tmad_annual | Surface Reflectance Triple Median Absolute Deviation 25 metre, 100km tile, Australian Albers Equal Area projection (EPSG:3577) | None | None | None |
| mangrove_cover | mangrove_cover | Mangrove Cover, Australian Albers Equal Area projection (EPSG:3577) | None | None | None |
| multi_scale_topographic_position | multi_scale_topographic_position | Multi-scale Topographic Position Image | None | None | None |
| nidem | nidem | National Intertidal Digital Elevation Model 25m 1.0.0 | None | EPSG:3577 | (-25, 25) |
| s1_gamma0_geotif_scene | s1_gamma0_geotif_scene | Sentinel-1A/B SAR Gamma0 scenes, processed to the CEOS ARD standard - Orbit updates, GRD border noise, thermal noise, radiometric calibration and terrain correction, orthorectification. | None | None | None |
| s2a_ard_granule | s2a_ard_granule | Sentinel-2A MSI Definitive ARD - NBART and Pixel Quality | CC-BY-4.0 | None | None |
| s2a_nrt_granule | s2a_nrt_granule | Sentinel-2A MSI ARD NRT - NBAR NBART and Pixel Quality | None | None | None |
| s2b_ard_granule | s2b_ard_granule | Sentinel-2B MSI Definitive ARD - NBART and Pixel Quality | CC-BY-4.0 | None | None |
| s2_barest_earth | s2_barest_earth | The Sentinel-2 Barest Earth | None | None | None |
| s2b_nrt_granule | s2b_nrt_granule | Sentinel-2B MSI ARD NRT - NBAR NBART and Pixel Quality | None | None | None |
| water_bodies | water_bodies | Water Body ID Map | None | EPSG:3577 | (-25, 25) |
| weathering_intensity | weathering_intensity | Weathering Intensity Model | None | None | None |
| wofs_albers | wofs_albers | Historic Flood Mapping Water Observations from Space | None | None | None |
| wofs_annual_summary | wofs_annual_summary | Water Observations from Space Annual Statistics | None | None | None |
| wofs_apr_oct_summary | wofs_apr_oct_summary | Water Observations from Space April to October Statistics | None | None | None |
| wofs_filtered_summary | wofs_filtered_summary | Water Observations from Space Statistics confidence filtered | None | None | None |
| wofs_nov_mar_summary | wofs_nov_mar_summary | Water Observations from Space November to March Statistics | None | None | None |
| wofs_summary | wofs_summary | Water Observations from Space Statistics | None | None | None |
List measurements
Most products are associated with a range of available measurements. These can be individual satellite bands (e.g. Landsat’s near-infrared band) or statistical product summaries.
The dc.list_measurements() function can be used to interrogate the measurements associated with a given product (specified by the name column from the table above). For example, ga_ls5t_ard_3 refers to the Geoscience Australia Landsat 5 Analysis-ready data Collection 3 product.
The table below includes a range of technical information about each band in the ga_ls5t_ard_3 dataset, including any aliases which can be used to load the data, the data type or dtype, any flags_definition that are associated with the measurement (this information is used for tasks like cloud masking), and the measurement’s nodata value.
Change the product name below and re-run the following cell to explore available measurements associated with other products.
[4]:
product = "ga_ls5t_ard_3"

measurements = dc.list_measurements()
measurements.loc[product]
[4]:
| name | dtype | units | nodata | aliases | flags_definition | spectral_definition | |
|---|---|---|---|---|---|---|---|
| measurement | |||||||
| nbart_blue | nbart_blue | int16 | 1 | -999 | [nbart_band01, blue] | NaN | NaN |
| nbart_green | nbart_green | int16 | 1 | -999 | [nbart_band02, green] | NaN | NaN |
| nbart_red | nbart_red | int16 | 1 | -999 | [nbart_band03, red] | NaN | NaN |
| nbart_nir | nbart_nir | int16 | 1 | -999 | [nbart_band04, nir] | NaN | NaN |
| nbart_swir_1 | nbart_swir_1 | int16 | 1 | -999 | [nbart_band05, swir_1, swir1] | NaN | NaN |
| nbart_swir_2 | nbart_swir_2 | int16 | 1 | -999 | [nbart_band07, swir_2, swir2] | NaN | NaN |
| oa_fmask | oa_fmask | uint8 | 1 | 0 | [fmask] | {'fmask': {'bits': [0, 1, 2, 3, 4, 5, 6, 7], 'values': {'0': 'nodata', '1': 'valid', '2': 'cloud', '3': 'shadow', '4': 'snow', '5': 'water'}, 'description': 'Fmask'}} | NaN |
| oa_nbart_contiguity | oa_nbart_contiguity | uint8 | 1 | 255 | [nbart_contiguity] | {'contiguous': {'bits': [0], 'values': {'0': False, '1': True}}} | NaN |
| oa_azimuthal_exiting | oa_azimuthal_exiting | float32 | 1 | NaN | [azimuthal_exiting] | NaN | NaN |
| oa_azimuthal_incident | oa_azimuthal_incident | float32 | 1 | NaN | [azimuthal_incident] | NaN | NaN |
| oa_combined_terrain_shadow | oa_combined_terrain_shadow | uint8 | 1 | 255 | [combined_terrain_shadow] | NaN | NaN |
| oa_exiting_angle | oa_exiting_angle | float32 | 1 | NaN | [exiting_angle] | NaN | NaN |
| oa_incident_angle | oa_incident_angle | float32 | 1 | NaN | [incident_angle] | NaN | NaN |
| oa_relative_azimuth | oa_relative_azimuth | float32 | 1 | NaN | [relative_azimuth] | NaN | NaN |
| oa_relative_slope | oa_relative_slope | float32 | 1 | NaN | [relative_slope] | NaN | NaN |
| oa_satellite_azimuth | oa_satellite_azimuth | float32 | 1 | NaN | [satellite_azimuth] | NaN | NaN |
| oa_satellite_view | oa_satellite_view | float32 | 1 | NaN | [satellite_view] | NaN | NaN |
| oa_solar_azimuth | oa_solar_azimuth | float32 | 1 | NaN | [solar_azimuth] | NaN | NaN |
| oa_solar_zenith | oa_solar_zenith | float32 | 1 | NaN | [solar_zenith] | NaN | NaN |
| oa_time_delta | oa_time_delta | float32 | 1 | NaN | [time_delta] | NaN | NaN |
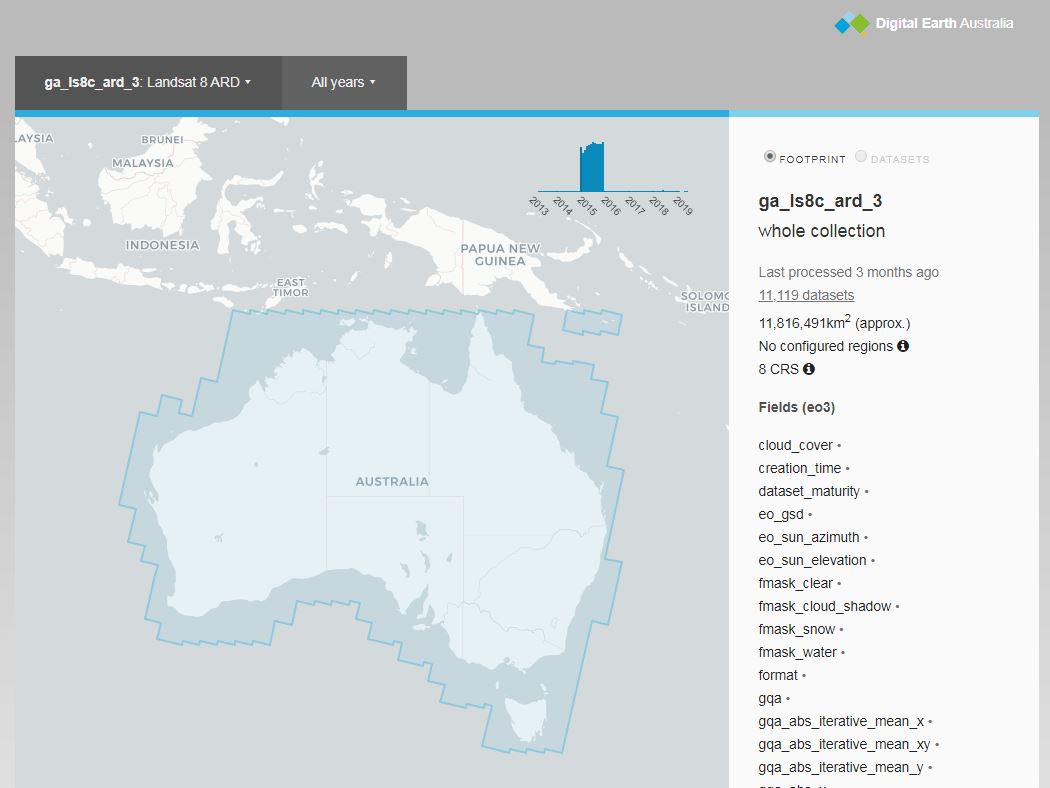
Visualising available data
The interactive DcViewer utility provides a more visual way of exploring the data that is available within the Digital Earth Australia datacube.
After running the cell below, select a product from the drop-down menu on the top-right of the map to show the areas where data are available in blue. Use the back and forward buttons above the map to toggle through time.
The utility is only able to visualise a limited number of datasets at one time. If the available data footprints do not appear, either press the “show” button on the top right, or zoom in on the map.
[5]:
DcViewer(dc=dc,
         time="2015",
         width="800px",
         center=(-27.48, 153.10),
         zoom=7)
DEA Explorer sites
Another way to view the available data within a datacube is to visit the DEA Datacube Explorer sites. These webpages visualise the data that is available for every product in DEA.
There is a different Datacube Explorer page for both the NCI and DEA Sandbox environments to account for the different datasets that are available in each of these datacubes:
Recommended next steps
To continue working through the notebooks in this beginner’s guide, the following notebooks are designed to be worked through in the following order:
Products and measurements (this notebook)
Once you have worked through the beginner’s guide, you can join advanced users by exploring:
The “DEA_products” directory in the repository, where you can explore DEA products in depth.
The “How_to_guides” directory, which contains a recipe book of common techniques and methods for analysing DEA data.
The “Real_world_examples” directory, which provides more complex workflows and analysis case studies.
Additional information
License: The code in this notebook is licensed under the Apache License, Version 2.0. Digital Earth Australia data is licensed under the Creative Commons by Attribution 4.0 license.
Contact: If you need assistance, please post a question on the Open Data Cube Slack channel or on the GIS Stack Exchange using the open-data-cube tag (you can view previously asked questions here). If you would like to report an issue with this notebook, you can file one on
GitHub.
Last modified: December 2023
Compatible datacube version:
[6]:
print(datacube.__version__)
1.8.6
Tags
Tags: sandbox compatible, NCI compatible, dc.list_products, dc.list_measurements, products, measurements, landsat 5, datacube explorer, DcViewer