2.0.0: DEA Waterbodies (Landsat)
2.0.0: DEA Waterbodies (Landsat)
Geoscience Australia Landsat Waterbodies Collection 3
- Version:
2.0.0 (See latest version)
- Product types:
Derivative, Vector
- Time span:
1986 – present
- Update frequency:
Daily
Old version
This is an old version of the product. See the latest version.
About
Locate over 300,000 waterbodies across Australia and look back at their changes over three decades with Digital Earth Australia (DEA) Waterbodies. Monitor critical lakes and dams, including hard-to-reach waterbodies in remote areas and on large properties.
Access the data
For help accessing the data, see the Access tab.
See it on a map
Download the shapefile
Access the data on AWS
Code examples
Github repository
Web Mapping Service (WMS)
Key details
Parent product(s) |
|
Collection |
Geoscience Australia Landsat Collection 3 |
DOI |
|
Licence |
Publications
Krause, Claire E., Newey, Vanessa, Alger, Matthew J., Lymburner, Leo. 2021. Mapping and Monitoring the Multi-Decadal Dynamics of Australia’s Open Waterbodies Using Landsat. Remote Sens. 13, no. 8: 1437. https://doi.org/10.3390/rs13081437
Mueller, N., Lewis, A., Roberts, D., Ring, S., Melrose, R., Sixsmith, J., Lymburner, L., McIntyre, A., Tan, P., Curnow, S., & Ip, A. (2016). Water observations from space: Mapping surface water from 25 years of Landsat imagery across Australia. Remote Sensing of Environment, 174, 341–352. https://doi.org/10.1016/j.rse.2015.11.003
Background
Up-to-date information about the extent and location of surface water in Australia provides us with a common understanding of this valuable and increasingly scarce resource.
What this product offers
Digital Earth Australia Waterbodies uses Geoscience Australia’s archive of over 30 years of Landsat satellite imagery to identify where over 300,000 waterbodies are in the Australian landscape and tells us the wet surface area within those waterbodies.
The tool uses a water classification for every available Landsat satellite image and maps the locations of waterbodies across Australia. It provides a time series of wet surface area for waterbodies that are present more than 10% of the time and are larger than 2,700m2 (3 Landsat pixels).
The tool indicates changes in the wet surface area of waterbodies. This can be used to identify when waterbodies are increasing or decreasing in wet surface area.
Applications
Understand local through to national-scale surface water dynamics over time and geography
Provide supporting information to better manage water across Australia
Gain insights into the severity and spatial distribution of drought
Identify potential water sources for aerial firefighting during bushfires
Get deeper insight into DEA Water Observations data
Technical information
The DEA Waterbodies product is comprised of two key components:
a polygon dataset of automatically mapped waterbody outlines, and
a csv time series for each polygon capturing the surface area of water within each polygon at every available, clear Landsat observation.
Producing DEA Waterbodies
DEA Waterbodies is a polygon-based view of DEA Water Observations (DEA WO), derived through the automatic processing of DEA WO to identify the outlines of persistent waterbodies across Australia (Figure 1).
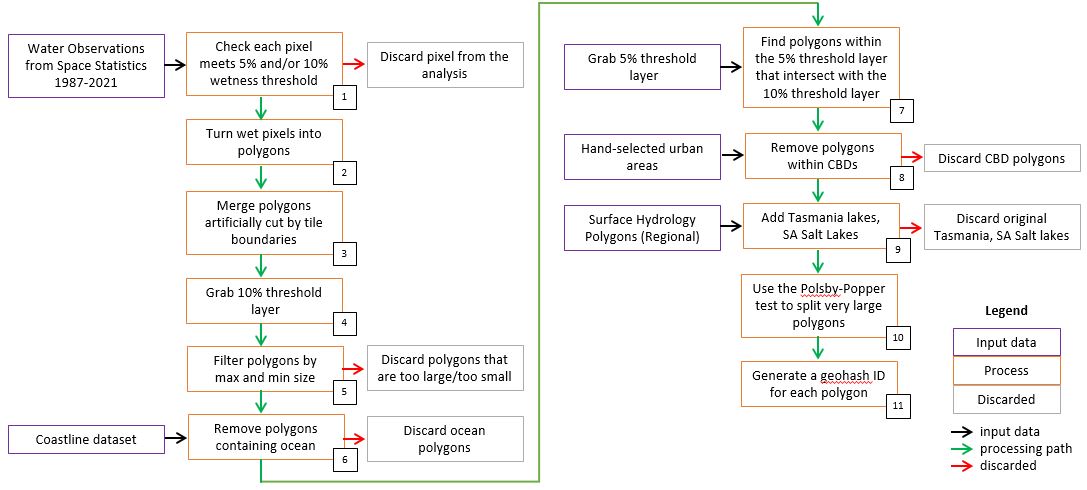
Figure 1: Flow diagram outlining the steps taken to produce DEA Waterbodies v2 polygons
For a detailed discussion of the methods used to produce DEA Waterbodies v1, refer to Krause et al. 2021.
Lineage
This product builds upon DEA Water Observations.
The code used in the development of this product is available on GitHub.
References
Krause, Claire E., Newey, Vanessa, Alger, Matthew J., Lymburner, Leo. 2021. Mapping and Monitoring the Multi-Decadal Dynamics of Australia’s Open Waterbodies Using Landsat. Remote Sens. 13, no. 8: 1437. https://doi.org/10.3390/rs13081437
Mueller, N., Lewis, A., Roberts, D., Ring, S., Melrose, R., Sixsmith, J., Lymburner, L., McIntyre, A., Tan, P., Curnow, S., & Ip, A. (2016). Water observations from space: Mapping surface water from 25 years of Landsat imagery across Australia. Remote Sensing of Environment, 174, 341–352. https://doi.org/10.1016/j.rse.2015.11.003
Accuracy
For a full discussion of the accuracies and limitations of DEA Waterbodies, please refer to Krause et al. 2021.
Inaccuracies inherited from DEA Water Observations (WO)
Many of the inaccuracies and limitations of the waterbody analysis are inherited from WO, with this product a reanalysis and mapping product built off the WO datasets. WO has a number of known limitations, and these manifest as misclassified waterbodies within this analysis. WO uses the spectral signature of water to classify wet pixels, and is known to be suboptimal in locations where water and vegetation are mixed. This includes locations such as rivers with vegetated riparian zones and vegetated wetlands. The effect of this can be seen by the discontinuity of narrower river features identified within this analysis, and an under representation of water within vegetated wetlands, such as the Macquarie Marshes, NSW.
Other known WO limitations have been limited through the filtering processes used to produce the map of waterbodies. Issues with mixed water and vegetation pixels around features like small farm dams have been avoided by limiting the size of mapped waterbodies to at least five Landsat pixels. Misclassification of water in deep shadows in high density cities has been handled by removing any waterbody polygons identified within CBDs. Intermittently misclassified features, which return valid results only a handful of times over the 32 year study period, are also filtered out by testing for the number of valid observations returned for each pixel.
Despite this, some errors remain in the final waterbodies dataset. Steep terrain shadows present a known difficulty for the WO classifier, due to the shadows produced. While WO has attempted to mitigate this issue, some misclassification remains. We have not specifically attempted to address these errors within this workflow, and as such, a negligible number of the identified waterbodies may in fact be artifacts caused by terrain shadow. The signal to noise ratio over deeper water has also not been addressed here, and may result in some pixels missing from the centre of deeper waterbodies, resulting in doughnut-shaped mapped polygons. Similarly, different water colours may interfere with the decision-tree classifier, resulting in very turbid or coloured waterbodies being misclassified.
The automatic cloud masking algorithm used in this analysis can misclassify bright, white sands seen on the bottom of some waterbodies as clouds. This issue is particularly problematic where these bright sands are only exposed when the waterbody begins to empty, resulting in the bright sands being seen inconsistently over time. It is very difficult to accurately cloud mask these sands, as they are seen in some scenes but not others, in the same way that clouds come and go between scenes. In this version of DEA Waterbodies, we have not addressed this issue, and note it as a limitation that results in short or missing timeseries; the sands are incorrectly classified as cloud, and the scene is thrown out as being unsuitable, resulting in very few ‘clear’ scenes. We hope to address this issue in the next release of the DEA Waterbodies product.
For a full discussion of the limitations and accuracy of WO, see Mueller et al. (2016).
Access the data
See it on a map |
Learn how to use DEA Maps |
|
Get the data online |
Learn how to access the data via AWS |
|
Code sample |
Learn how to use the DEA Sandbox |
|
Get via web service |
Learn how to use DEA’s web services |
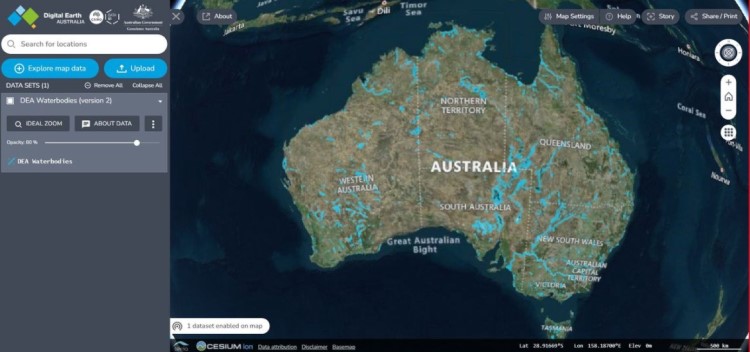
How to view the data in a web map
To explore DEA Waterbodies on the interactive DEA Maps platform, visit the link below:
https://maps.dea.ga.gov.au/#share=s-4RjD9N7swBCZSkXRJJBxOLzVZyK
and dismiss the overlay. DEA Waterbodies will already be loaded on the map.
To add DEA Waterbodies to DEA Maps manually:
Visit DEA Maps.
Click
Explore map data.Select
Inland water>DEA Waterbodies>DEA Waterbodies (version 2).Click
Add to the map, or the+symbol to add the data to the map.
Is there a DEA Waterbodies User Guide?
Yes!
See Waterbodies user guide to discover how to get the most out of the DEA Maps presentation of DEA Waterbodies including how to explore time series, and how to download the data from a particular time series.
What about if I have more questions?
Check out the DEA Waterbodies Frequently Asked Questions guide to see if your questions are answered there.
If you need more help, contact earth.observation@ga.gov.au.
Other versions
You can find the history in the latest version of the product.
Frequently asked questions
About the waterbody graphs
Is this product showing waterbody volume?
No. DEA Waterbodies does not measure the volume of water in any waterbody.
The tool detects the wet surface area of a waterbody. The wet surface area does not correlate to the volume of water in a storage. For example a waterbody can be observed as wet with just a shallow covering of water.
What does ‘100%’ wet surface area refer to?
The outline of each waterbody corresponds to the maximum observed wet surface area of the waterbody between 1987 and 2020. In the time series, this maximum area is considered as 100% wet surface area. The 100% wet surface area does not correlate to the volume of water in a storage. For example a waterbody can be observed as wet with just a shallow covering of water.
Do the time series provide information on the source of water observed?
No. This tool does not differentiate between water sources.
How often are the DEA Waterbodies time series updated?
The DEA Waterbodies time series are updated at least monthly. An individual time series may not be updated as frequently if it was cloudy on the days the satellite was overhead.
Landsat satellites do not observe all of Australia at the same time. The dates of satellite observations are dependent on the date that the satellite observed that waterbody. Landsat satellites take 16 days to collect data across all of Australia, with different locations being collected on different days within that 16 days.
Why are some time series shorter than others?
All useable observations for each waterbody have been included in the individual waterbody time series. Short or missing time series can result from frequent cloud cover, misclassification, or other processing issues.
If less than 90% of the total waterbody is observed on any one day, due to cloud cover or missing data, then that observation is marked as a missing value within the csv file.
Cloud cover leading to invalid data can be a particular problem in coastal regions, northern Australia during summer, and in Tasmania.
How does DEA Waterbodies deal with clouds?
Data used within DEA Waterbodies is cloud masked. If less than 90% of the total waterbody is observed on any one day, due to cloud cover or missing data, then that observation is marked as a missing value.
Cloud cover leading to invalid data can be a particular problem in coastal regions, northern Australia during summer, and in Tasmania.
Why are the time series irregularly spaced in time?
Landsat satellites do not observe all of Australia at the same time. The dates of satellite observations are dependent on the date that the satellite observed that waterbody. Landsat satellites take 16 days to collect data across all of Australia, with different locations being collected on different days within that 16 days. This means that the date stamps of each time series are not common across all waterbodies.
What are the two different time series provided for each waterbody?
Within the DEA Waterbodies web service, there are two time series provided for each waterbody, which can be seen in the legend panel on the left hand side once a waterbody has been selected, and the time series expanded:
‘Percentage of total surface area observed as wet’: the percentage of the total surface area of the waterbody that has been classified as ‘wet’ for each time step. (Note: this is not a volume)
‘Wet Pixel Count’: the total number of pixels that have been classified as ‘wet’ for each time step. This value is useful if you need to calculate an area of wet pixels. Each pixel is 30 metres by 30 metres.
About the mapped waterbodies
What satellite imagery does DEA Waterbodies use?
DEA Waterbodies is based on Landsat satellite data provided by the United States Geological Service. The Digital Earth Australia (DEA) program within Geoscience Australia corrects this data and makes it available publicly.
The tool uses data from the Landsat 5 TM (1987–2011), Landsat 7 ETM+ (1999–present), and Landsat 8 OLI (2013–present) missions.
To find out more about the Landsat missions, check out the USGS Landsat Missions webpages
How do you classify water from satellite imagery?
The water classifier that is used by DEA Waterbodies is the DEA Water Observations algorithm. It is a decision tree algorithm that classifies each pixel as ‘wet’, ‘dry’ or ‘invalid’.
For details on how the Water Observations from Space algorithm classifies water, see this paper
How big does a waterbody have to be to be included?
DEA Waterbodies only maps waterbodies larger than 2,700 m2 (3 whole Landsat pixels). This size was chosen to minimise noise caused by large numbers of small wet areas in the landscape.
What does the outline of individual waterbodies represent?
The outline of each waterbody corresponds to the maximum observed wet surface area of the waterbody between 1987 and 2020. DEA Waterbodies is derived completely from satellite data, which means that the outline of each waterbody is based entirely on the extent of water mapped by satellite observations.
It may not directly match up with the edges of a waterbody, as the edges themselves are not inundated, and so will not be captured within the wet extent. The waterbodies also may not match up with the previously mapped extent of any waterbody found in other map products.
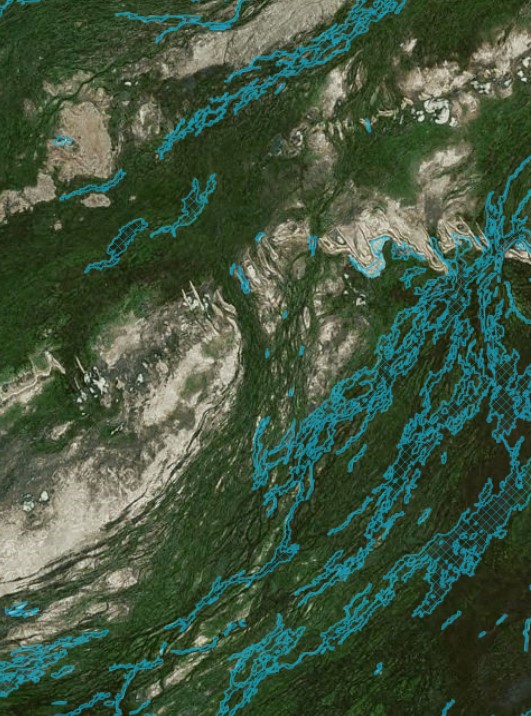
Why do the waterbodies look pixelated?
DEA Waterbodies is derived completely from satellite data, which means that the outline of each waterbody is based entirely on the extent of water mapped by satellite observations. The pixelated outlines show which satellite pixels have been included inside each waterbody. We chose not to smooth the outlines of the waterbodies to make it clear that this mapping has been done using satellite data, and to make it clear which pixels have been included in each waterbodies’ time series.
There is a waterbody missing from your map. Why?
There are a few reasons why a waterbody might be missing:
It might be too small: DEA Waterbodies only maps waterbodies larger than 2,700m2 (3 whole Landsat pixels).
It might not have been wet enough: DEA Waterbodies only maps waterbodies that have been observed as wet at least 10% of the time between 1987 and 2020. If a waterbody fills very infrequently, it may not meet this threshold.
The waterbody might have too much vegetation surrounding it: the DEA Water Observations classifier that determines where water is observed does not work well where water is combined with vegetation. If there is vegetation obscuring the water (like a tree leaning across a river or a wetland), the classifier will not see this as water and the waterbody may not be mapped.
The water in the waterbody does not look like water: very sediment-filled water, particularly in northern Australia, is often misclassified as land.
It might be new: newly constructed waterbodies will not be included in this product as they will not have been observed as wet at least 10% of the time between 1987 and 2020. Waterbodies that have been constructed or modified after 2016 may not be captured within this tool. Future updates of this product should capture newer waterbodies.
If there is a waterbody missing from DEA Waterbodies that you would like to report, please contact us at dea@ga.gov.au
Reports of missing waterbodies may assist us during quality checking of future product releases.
Why are there whole/parts of rivers missing?
The DEA Water Observations classifier that determines where water is observed does not work well where water is combined with vegetation. If there is vegetation obscuring the water (like a tree leaning across a river), the classifier will not see this as water, and the waterbody will be cut short, even though the river continues along underneath the vegetation.
Additionally, the Landsat satellite data on which this dataset is based has a pixel resolution of 30 metres by 30 metres. A pixel will only be classified as water where the pixel is almost entirely made up of water. For example, where rivers narrow or contain large sandbanks the pixel will incorporate these other signatures, and not be classified as water.
Both of these factors mean that rivers are not seen as continuous features throughout DEA Waterbodies.
Why are some of the waterbody polygons patchy?
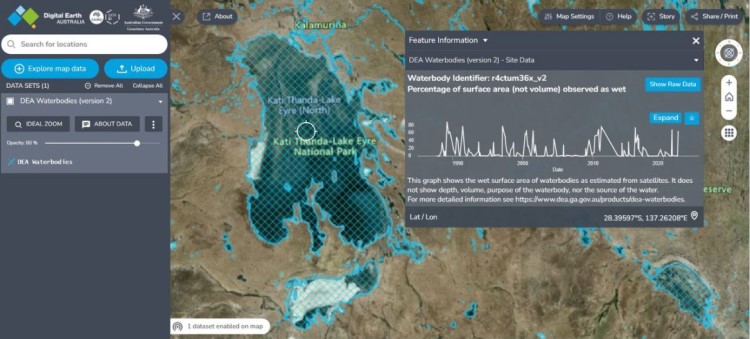
Some of the waterbody polygons contain holes, or are quite irregularly shaped. This is caused by the DEA Water Observations classifier not seeing these ‘missing bits’ as water frequently enough, and so they are excluded. This is particularly evident in the very large waterbodies in central Australia, like Kati Thanda–Lake Eyre, where the inflow points to the north of the lake are infrequently inundated when compared to the southern end of the lake, where water pools in the landscape.
Additionally the DEA Water Observations classifier that determines where water is observed does not work well where water is combined with vegetation. If there is vegetation obscuring the water (like a tree leaning across a river or a wetland), the classifier will not see this as water and the resulting mapped waterbody may be patchy.
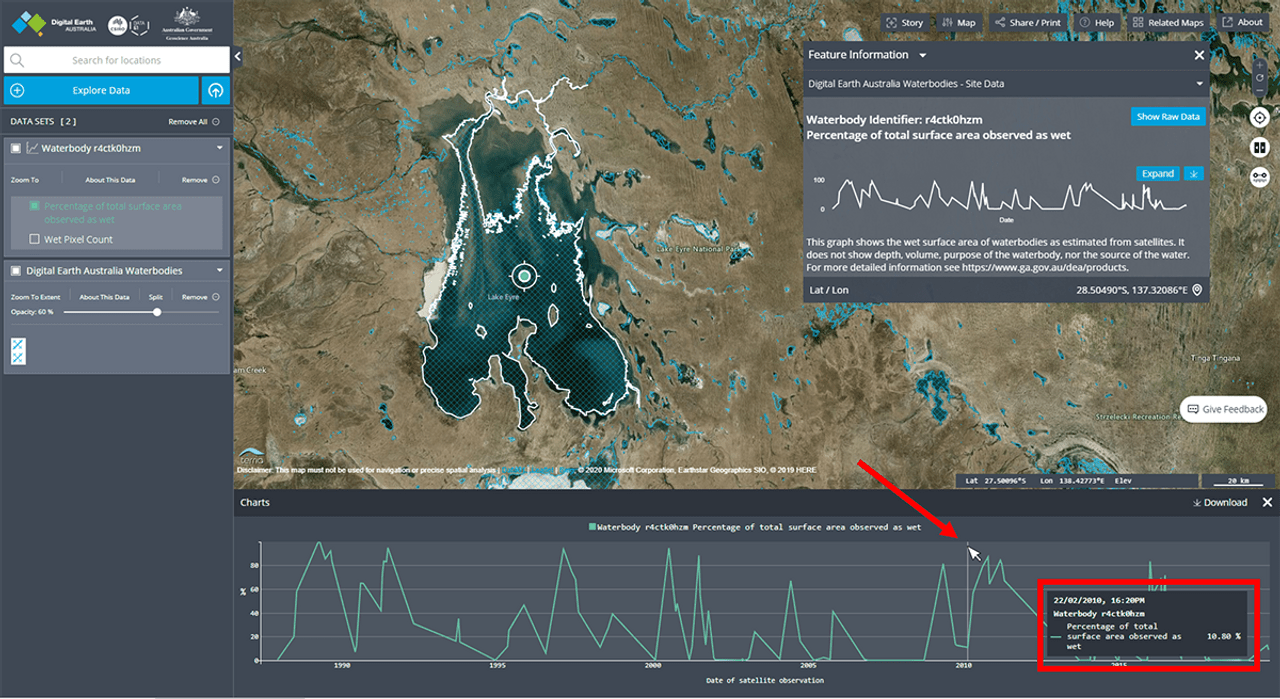
Kati Thanda–Lake Eyre as mapped within DEA Waterbodies
Why are some waterbodies fused together instead of being separate?
DEA Waterbodies are mapped using water classified pixels. If a pixel is predominantly water, it will be mapped as water. Small levees or roads between adjacent waterbodies will not necessarily separate the mapped waterbodies if they are not large enough to influence the total make up of their pixel. This means that some separate waterbodies are mapped as a single waterbody within DEA Waterbodies.
Does DEA Waterbodies show flooded areas?
By design, we have excluded locations where water is seen only during extreme flood events. A wetness threshold of 10% was applied to the data, meaning that only waterbodies observed as wet at least 10% of the time between 1987 and 2020 have been included. This threshold was determined to be sensitive enough to capture the locations of persistent waterbodies, but not so sensitive as to pick up too many false positives like flood irrigation, flood events or soggy areas in the landscape.
Other information about DEA Waterbodies
How do I download the data?
Individual waterbody time series can be downloaded within National Map and DEA Maps. Instructions on how to download individual time series can be found in the User Guide.
The underlying polygon dataset containing the map of over 300,000 waterbodies across Australia can be downloaded from the Access tab.
Can I load DEA Waterbodies into my GIS software?
DEA Waterbodies has been provided as a web mapping service. You can consume this service by connecting to the service endpoint (see the metadata provided with the layer in National Map or DEA Maps for details). Please note that for now, this service will only allow you to access the underlying waterbody map, not the individual time series associated with each waterbody.
How was DEA Waterbodies produced?
The code used to produce DEA Waterbodies has been uploaded to Geoscience Australia’s Github page. There is also a peer reviewed journal article that explains in detail the methods used to produce DEA Waterbodies.
How do I cite DEA Waterbodies?
Krause, Claire E.; Newey, Vanessa; Alger, Matthew J.; Lymburner, Leo. 2021. “Mapping and Monitoring the Multi-Decadal Dynamics of Australia’s Open Waterbodies Using Landsat” Remote Sens. 13, no. 8: 1437. https://doi.org/10.3390/rs13081437
Who did you collaborate with to produce DEA Waterbodies?
DEA Waterbodies was the result of a collaboration between Geoscience Australia, the NSW Department of Planning, Industry and Environment, and the Murray Darling Basin Authority to determine the potential of satellite imagery to provide useful insights about water in the landscape.
How do I get more information or provide feedback on DEA Waterbodies?
Contact us at Earth.Observation@ga.gov.au
Acknowledgments
This work was carried out in collaboration with NSW Department of Planning, Industry and Environment.
License and copyright
© Commonwealth of Australia (Geoscience Australia).
Released under Creative Commons Attribution 4.0 International Licence.